I bought a car recently. I’m cheap and practical and I’m going to be a father soon, so the only things I really cared about were:
- will the car keep my wife and child safe if they’re in an accident
- will the car keep running reliably
- how do I get 👆 those two things on the cheap
I’ve also been getting into machine learning and data science recently, so I thought it’d be useful to answer them using some data science tools. This post sums up what I learned about vehicle safety based on the Insurance Institute for Highway Safety’s data on traffic fatalities by make and model.
The tldr: drivers are less likely to die in a traffic accident if the vehicle they drive is heavier and larger. We’ll be able to see all of this with a few ggplot2 plots.
(“seem” and “may” are emphasized because the analysis I’ve done here merely suggests the above conclusions. A more complete sample of IIHS’s data would increase confidence in these conclusions.)
Data prep
The IIHS’s report only groups by fatalities by “vehicle size” and “vehicle type” (along with make and model). Becuase I didn’t know whether the “vehicle size” factors generalized across car types, I just googled the weights and sizes of the vehicles in the report.1
The data looks like this:
library(dplyr)
library(readr)
library(ggplot2)
fatalities_by_weight_and_size <- read_csv('./vehicle-fatalities.csv',
                                          locale = locale(grouping_mark = ",")
                                          )
rand_rows <- sample(nrow(fatalities_by_weight_and_size))
head(fatalities_by_weight_and_size[rand_rows,])
## # A tibble: 6 x 6
## `Make and Model` Class Size Weight Volume Fatalities
## <chr> <chr> <chr> <dbl> <dbl> <dbl>
## 1 buick verano car midsize 3300 757712 68
## 2 Kia Rio car mini 2494 616284 87
## 3 BMW X5 4WD Luxury SUV Midsize 5260 1012092 4
## 4 Lexus NX 200t 4WD Luxury SUV Midsize 4050 875420 0
## 5 toyota highliander suv midsize 4165 997424 13
## 6 Kia Forte car small 2804 705600 89We don’t ultimately care about the size and class columns, but let’s quickly normalize them to all be lower-case, just in case we’ll care later:
to_lower_factor <- function(f) {
  factor(tolower(as.character(f)))
}
fatalities_by_weight_and_size <- fatalities_by_weight_and_size %>%
  mutate(Class = to_lower_factor(Class), Size = to_lower_factor(Size))
head(fatalities_by_weight_and_size)
## # A tibble: 6 x 6
## `Make and Model` Class Size Weight Volume Fatalities
## <chr> <fct> <fct> <dbl> <dbl> <dbl>
## 1 GMC Yukon XL 1500 4WD suv very large 5800 1.34e6 0
## 2 Infiniti QX60 2WD Luxury suv midsize 4383 1.05e6 0
## 3 Land Rover Range Rover Evoque 4WD L… suv small 3615 8.26e5 0
## 4 Lexus NX 200t 4WD Luxury suv midsize 4050 8.75e5 0
## 5 Mercedes-Benz C-Class sedan 4WD Lux… car midsize 3594 7.49e5 0
## 6 Porsche Cayenne 4WD Luxury suv large 4488 1.01e6 0Plots
Now we can easily graph fatality by weight:
ggplot(fatalities_by_weight_and_size, aes(x=Weight, y=Fatalities)) +
  geom_point() +
  geom_smooth() +
  ggtitle("Weight's vs fatalities per 100 million miles driven")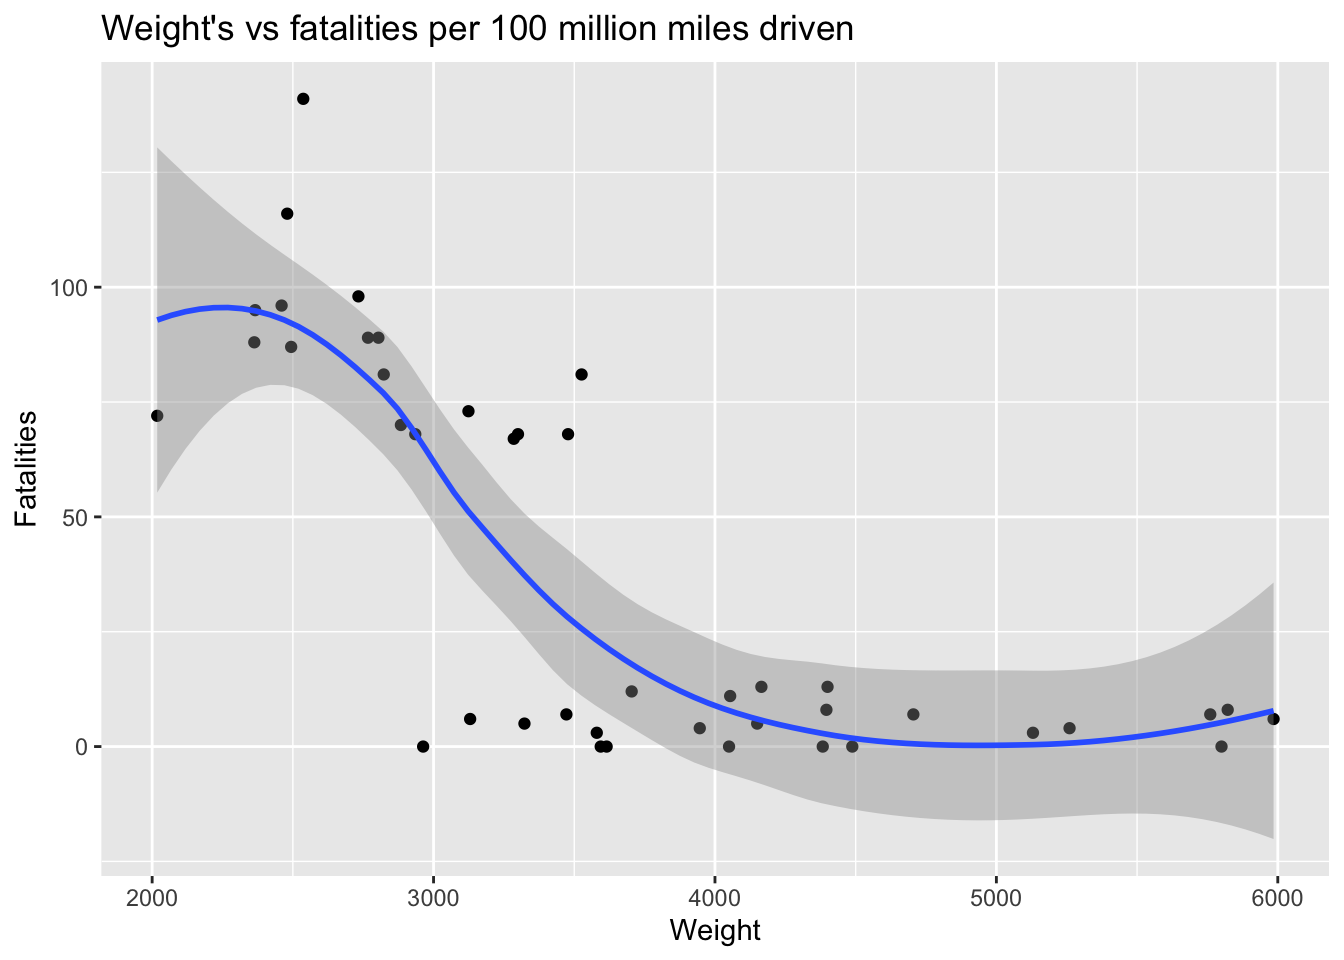
We can also graph fatality by car size:
ggplot(fatalities_by_weight_and_size, aes(x=Volume, y=Fatalities)) +
  geom_point() +
  geom_smooth() +
  ggtitle("Volume vs fatalities per 100 million miles driven")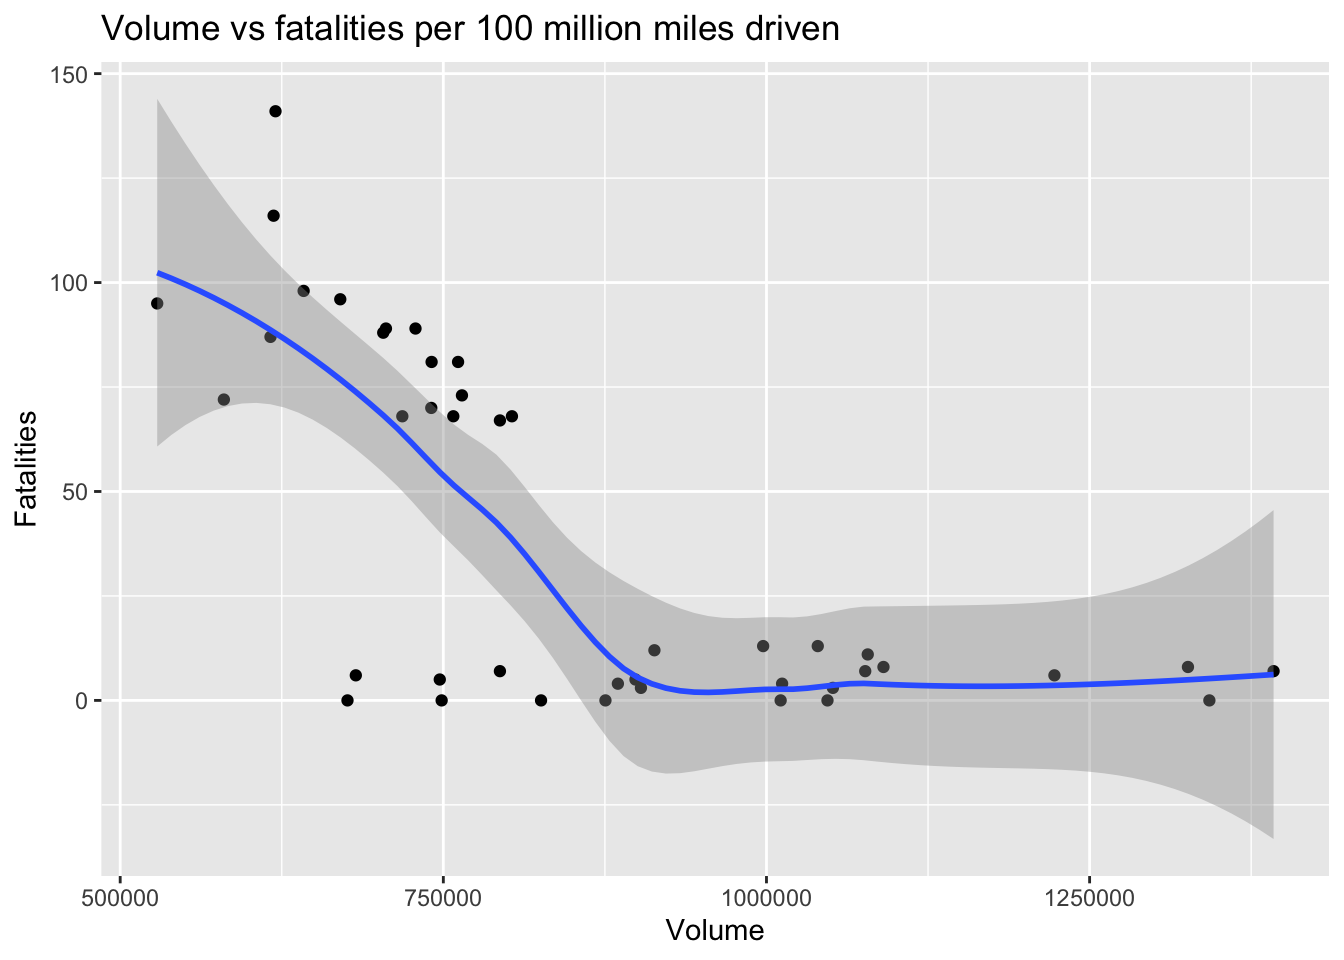
Conclusions
Like I said at the outset, the analysis here is only suggestive and needs more work. Still, if we accept the conclusion suggested by this analysis, there’s an interesting puzzle here: Why would fatalities go up for very large and very heavy cars? One possible explanation for the data is that people who tend to drive very large vehicles tend to drive less safely because they think they cannot be harmed.
Actually, what I did was focus on the best and worst vehicles from the report, which I realize is problematic for making inferences about all vehicles.↩︎